A plethora of “death crosses”!
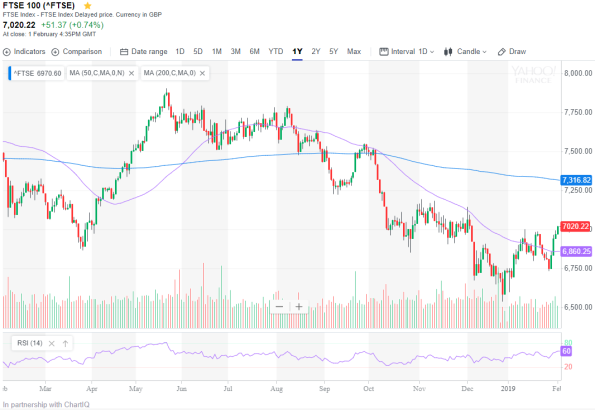 The FTSE didn’t plummet as I predicted in my last post, but went sideways for a few weeks then dropped to just above 6,500 points. Since then however, I have noticed two “death crosses” in the chart, one in March 2018 and another in October 2018. This is where the 50 day moving average crosses below the 200 day moving average and both lines are sloping downwards. It is a widely recognised chart pattern that usually indicates a longer-term downturn has started (rather than the short-term correction I forecast), though there is often a bounce shortly after the signal which is considered a last chance to sell. In the March case, the FTSE made a new all-time high (just) and I was thinking about selling out of my FTSE tracker, but was persuaded not to by the conspirators who insisted that I’d miss out on a melt-up if I did. The question is, how long will the downturn last? (The second signal is not too significant). The index broke its March low and is now rebounding, but there are still the problems of the China/US trade war (which neither side wants to lose face over) and the Italy debt crisis (which has the potential to wipe out the European banking system), so I think that, although the FTSE may continue to rebound for a while yet, there is likely to be significantly more downside to come fairly soon.

The Dow chart also features a death cross (in December 2018) and we are now probably in the last chance to sell rebound. This has paused at the 200 day moving average, but may go further. The same problems exist for the Dow as for the FTSE though, despite the US economy looking strong.
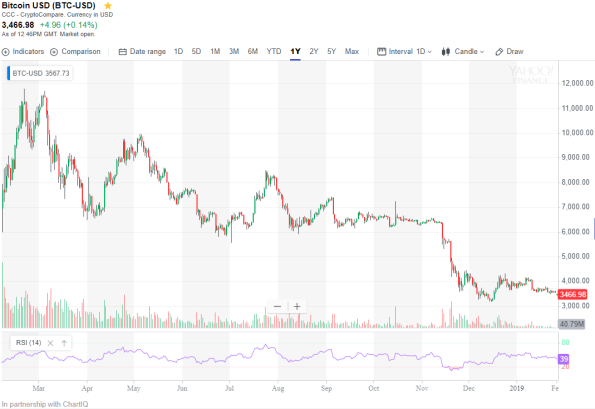 Bitcoin continued sideways for a few more weeks after my last post, but has now fallen, as predicted. There was a bounce just above $3,000 (the support level from the September 2017 crash and my initial target low), but it seems to be declining again now. I think the price is likely to fall significantly further as there is still no sign of “blood on the streets”.
FTSE teetering on the edge?
 Market uncertainty has been pulling the FTSE down for the last week and it is now closing in on the 7,000 point mark. Based on examination of similar chart patterns from the past, the index looks to me like it is teetering on the edge of a precipice now and, if (when) support at 7,000 is broken, we could be in for a sharp decline to the psychologically important level of 6,000 very quickly, i.e. in the next week or two. There is a number of things for the market to worry about: rising interest rates in the U.S., disruption to the eurozone by Italy’s populist government budget and, of course, Brexit. I had been looking forward to the mania stage of this bull run, but it looks like that will at least be postponed for now, if not cancelled altogether. The financial crisis hit in 2007 without a melt-up for the last run so perhaps we could see another crash here without one again, but I am not yet convinced of that. Looking at investment trust discounts (which often increase immediately prior to a crash) there is no sign of a longer-term change of mood. So I think this may just be a largish short-term correction of around 20% or so. 6,000 points could be the bottom for the FTSE and we could see a drop of a few thousand points in the Dow Jones (which seems to have finally caught a dose of the jitters as well now, with an 800 point drop last night), but we will have to keep a close eye on progress.
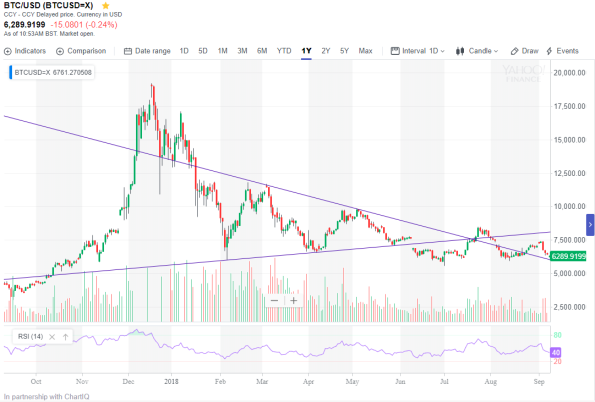
 I have adjusted my wedge lines in the bitcoin chart so that they show a new pattern of which we are reaching the point now. The bitcoin price has found strong resistance at the upper line in the last few days and has now dropped sharply through the bottom line; could this be the start of the next stage of the crash I predicted in my last post? I am not sure yet as my forecast was highly influenced by the messages I get through the media and is therefore likely to be completely wrong! Again, it is a case of watching and waiting.
Bitcoin is looking wobbly again.
 We did get the bounce I predicted in my last post, and it went further up than I forecast, verging on overbought territory (Relative Strength Indicator – RSI > 80). The price then dropped again as would be expected, but didn’t make a new post-crash low, which was a positive sign and I was hoping that bitcoin may have turned a corner. It drifted back up after that, but, a week ago was looking like it had run out of steam, so I was expecting a bit of a dip. This has happened, though the price fell more sharply and slightly further than I anticipated, cancelling out the positivity and suggesting that there could be further to go in this drop. (Short-term corrections tend not to exceed nine or ten per cent and this drop was around thirteen per cent). It is usual, after a crash like we have had this year, for the drop to end when buyers capitulate and sentiment turns very negative, but this hasn’t happened yet with bitcoin. Consequently, I think the price could drop substantially from here, perhaps below $1,000, as there is a strong band of supporters (the HODLers – Holders On for Dear Life) who will take a lot of pain before capitulating. It is important to remember that, although the bitcoin price has fallen by more than two thirds since it peaked in December, it is still above where it was a year ago, so any longer term investors will still be in profit at the moment and so still not too worried. It is also worth noting that it is less than two years since bitcoin regained the $1,000 level, so this level is by no means out of range.
 The FTSE did continue to drift upwards for a while, as I suggested in my last post, but, in the last few weeks has fallen, despite support from a falling pound (which makes foreign earnings more valuable to FTSE multi-nationals). I haven’t discerned any particular reason for this being attributed by the commentariat, so I think it has to be put down to general Brexit anxiety. There have been comments about the relatively high likelihood of a no deal exit, which appear to have spooked the market. There is significant support at 7,200 points, so I think the index may well bounce there, but I don’t have any strong feelings about what is likely after that as it is too dependent on politics.
Is Bitcoin about to bounce again?
 As I forecast in my last post, bitcoin has dropped out of its wedge pattern, hitting a new post crash low a couple of weeks ago. Since then however, it has essentially gone sideways, and, since the initial fall wasn’t as sharp as I anticipated, I am led to think that, on the principle of what doesn’t go down will probably go up, we may be due another bounce. For now, I am abandoning the idea of a return to $3,000, though I may return to it at some point, and instead looking for a move up of at least $1,000 to the falling wedge line.
 The FTSE has continued to travel mostly sideways since my last post, though losing a bit of ground due to the fears over President Trump’s trade war. The generally good news about the overall health of the US economy has stopped the index from falling significantly. I suspect it will continue to drift upwards over the coming weeks with the occasional FUD (Fear, Uncertainty and Doubt) induced spasm.
Is Bitcoin about to break out of a wedge?
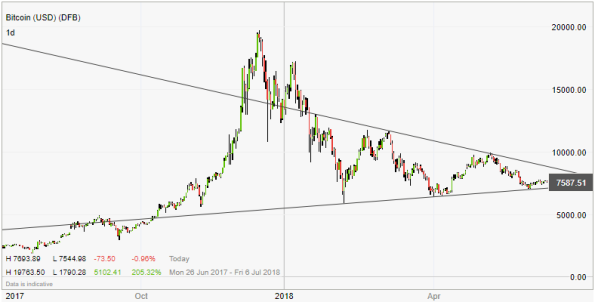 As can be seen from the chart above, the bitcoin price has formed a wedge since the beginning of the year. This chart pattern usually indicates that a sharp move is likely as the point of the wedge gets nearer, though, at the moment, I am not confident which way it is going to move. Although I said in my last post that I thought the rout might be over, and the price did bounce about 50% from that point, it has come most of the way back down now and the current uptrend is looking very feeble, so I am inclined to think that the move may be downward. The institutional money may still be trying to destroy bitcoin (and other crypto-currencies) because it is a threat to the traditional banking system, due to it removing the need for central banks and intermediaries in financial transactions, and so I wouldn’t be surprised now to see a new low of around $3,000 come into play from here. This is the support level from the bottom of the 40% drop last September. Ultimately, I believe that the establishment will fail to kill off bitcoin, but I expect the battle to continue for a while yet. I have even seem some commentators saying that it could become the global currency of the internet, which would really threaten the banks, but there are technical issues over low transaction rates to be solved before that could happen.
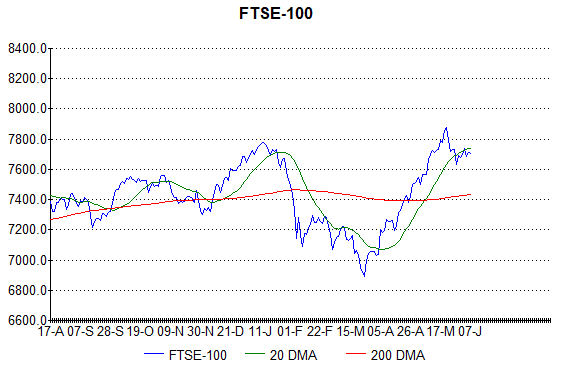 Turning to the FTSE, we have seen a strong bounce as I predicted in my last post, though we didn’t get the last dip I forecast. There is much hoohah about Italy at the moment, with a euro-sceptic government now in power, but I suspect that they will make no significant moves for a while yet. Italy has very high debt levels and low economic growth which means that its population is restive and want their government to “do something”. This malaise is blamed on the EU, so the “something” is likely to be breaching EU spending limits, or pulling out of the euro altogether, and either of these would be a serious concern for the markets across Europe, including the UK. There is even potential for a debt default if Italy exits the euro, which would cause chaos in the banking system due to the large amount of that debt widely held by many institutions. However, as I say, I think this concern is overdone at the moment and shouldn’t affect the FTSE for now, so I am still optimistic that the recent dip is just a pause for breath and the current run will continue in the near term.
Bitcoin could be nearing its bottom.
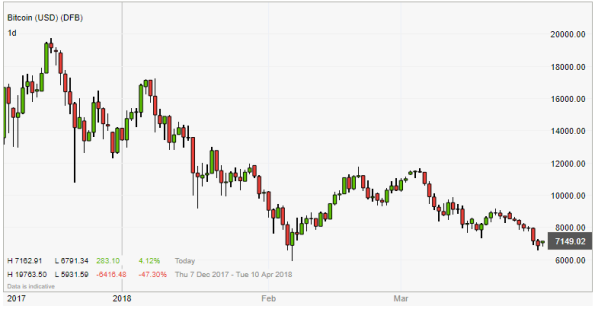
The volatility in bitcoin has declined significantly in the last couple of weeks which could be a sign that the rout is coming to an end. We had bounces off the two support levels I mentioned in my last post, with a low just below $6,000. I suspect that level could be retested soon, but I am optimistic that it will hold. After possible consolidation, we should then see a rebound start.

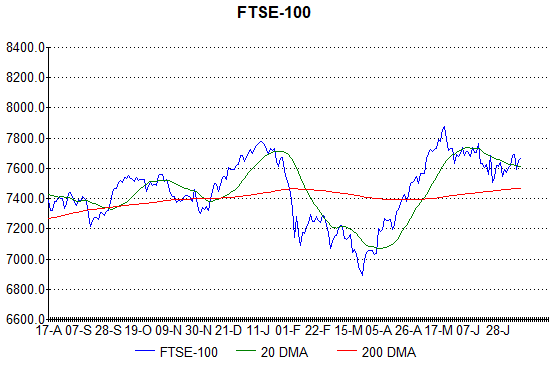
Well, my estimate of the size of the drop in the FTSE-100 was a bit on the low side, to say the least! I think we could be nearing the bottom here too though. The fall in the index has roughly conformed to a pattern I have seen several times, where there is a shelf about half way down, followed by two spikes back to the 20-day moving average (the green line) after lower lows. The chart shows that we are currently nearing the top of the second spike, so I am looking for a further dip back to around 6,800 after which the bounce-back should begin.
I have noticed some commentators arguing that this bull market is getting rather long in the tooth, and that the current dip could be the start of a major crash, but I don’t agree. The UK stock market crashed in the early 1970’s, bottoming out at the end of 1974 and didn’t peak until July 1987, nearly 13 years later. The bottom here was in November of that year, and the next crash after that didn’t start until the beginning of 2000, over 12 years later. The current bull run is only 9 years old so it could easily be another three years before it peaks.
December bitcoin low is breached!
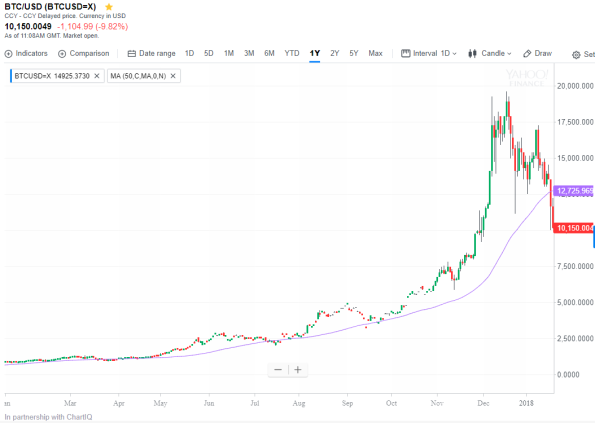 Well, it looks like I was wrong to call the current dip in bitcoin as normal volatility since the December low of $11,000 was breached yesterday night when the price fell to $10,000. That’s well below the 50 day moving average (the purple line in the above chart) which has been acting as a floor in recent times so it looks like the weakness is set to continue. If $10,000 is breached as well, then there isn’t much chart support until we hit $7,500 – $8,000 or, after that, $6,000. A low of $6,000 would be a fall of about 70% which would definitely qualify as a crash as far as I am concerned! (And there is no reason why it couldn’t go lower still). I suspect that, if the price did drop that far, it would take some time to recover due to the panicking effect this would have on all the new speculators who jumped in after bitcoin went mainstream when the price first crossed $10,000.
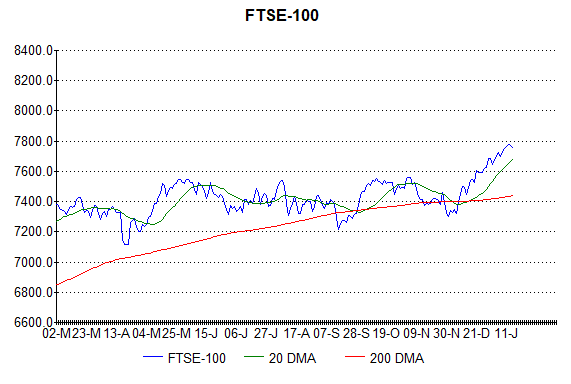 The FTSE has continued to rise nicely after its breakout, but I think it might pull back slightly before really taking off as it seems to be running out of steam now. A short dip back to support at 7,600 would seem reasonable.
Bitcoin slump is perfectly normal!
 This week Bitcoin slumped around 45% (from a high around $20,000 to chart support at $11,000) and has bounced back to around $15,000 since yesterday afternoon. This isn’t the crash I predicted a couple of weeks ago; it is just normal volatility. Looking at the chart above, you can see that the 50-day-moving-average (50dma – the purple line) has acted as a floor in recent times, and the fact that the price can dip 45% and still not hit this level just shows how overheated Bitcoin has become. As long as each low is higher than the previous one, the bull market is intact and we should see further progress after a period of consolidation from here (assuming that $11,000 proves to be the low for this dip). When the crash hits, the price will fall well below the 50dma and break the pattern of higher lows.
 The FTSE-100 has made a new closing high this week, breaking the 7,600 point barrier for the first time. The Trump tax cuts signed off this week should boost the stock market, so I am hopeful the FTSE can continue its climb.
Bitcoin goes mainstream!
 Since Bitcoin broke through the $10,000 level a few days ago, I’ve noticed a considerable amount of mainstream press coverage which, as a contrarian, makes me suspect we could be nearing a high. Another significant event is that two Chicago derivatives exchanges (CME and CBOE) are soon to offer Bitcoin futures which could increase the volatility of the cryptocurrency. If its surge continues, I think we could see a crash fairly soon, meaning that anyone buying in now could get their fingers burnt. I doubt this will be the end for Bitcoin though; we saw an 80% slump after it hit $1,200 in late 2014 and it has recovered from that, although it did take over two years to regain its high. If you are looking for a long-term, buy and hold investment, however, I think Ether could be a much better bet. It is the native token of the Ethereum blockchain which is supported by many large US companies and is currently trading at around $500. It saw a fifty-fold increase earlier in the year and has been consolidating since then, but recently achieved new highs and could benefit from any weakness in Bitcoin.
 With regard to the FTSE, it did fall to chart support at 7,400 as I suggested, where it paused and bounced back to the 20-day moving average, but has since fallen again to 7,300. It is now rebounding; could the traditional Santa rally see the break-out I have been looking for?
Bitcoin target hit!
 Bitcoin hit my $3,000 target for about three-quarters of an hour! And it got there a lot quicker than I expected so I didn’t catch the bottom, but, even so, I am currently running a nice profit on my investment due to the very strong rebound we have seen since then.
 Turning to the FTSE, it seems that the low wasn’t quite in as there has been another dip, but I am optimistic that a break-out may be imminent. I wouldn’t be surprised to see a small decline back to 7,400 quite soon as the index may struggle to break out of its range straight away, but, hopefully after that, 8,000 should be on.
I remain hopeful of much greater gains to come as I am still looking for a final, blow-off phase to the current bull market. (And I am not alone in this; see the articles here and here). While some commentators are adamant that the US stock market is over-valued, I disagree; some indicators are high by historical standards, but if you look at the more fundamental ones such as the Trailing Twelve Months (TTM) Price/Earnings (P/E) ratio and dividend yield, there is still plenty of scope for advancement. Consulting an old edition of the Financial Times, I can see that the US dividend yield fell to around 1% at the peak of the dot.com boom, but it is currently around twice that level, so, even without further dividend increases, the market could double from here before we hit crash inducing levels. And the P/E ratio is also well below danger levels at about 20 for the Dow: I would say that 12-15 is typical, 6 very cheap and 30 very expensive. So again, even without any increase in company profits (earnings), the index could rise 50% before it hits danger levels. And with interest rates much lower than in 2000, it is perfectly possible that previous levels could be exceeded significantly before a crash occurs.
